Established in 1987, Super Group is a Singapore-based investment holding company that manufactures and distributes branded consumer products, primarily instant coffee, instant cereals and instant tea mixes products. Its source of revenue stem from 2 main segments, Branded Consumer (BC) products and Food Ingredient (FI) products which account for 65% and 35% of revenue in FY2014 respectively. The company operates in three principal geographical areas, Singapore, Southeast Asia and East Asia. The Company has developed over 300 instant beverages and convenient food products. Some of the Company’s brands include Super, Owl, Super Power, YESTE, YeYe, Coffee King, SUPPER COFFEE and Nature Mill. Its subsidiaries include Super Coffee Corporation Pte. Ltd, Super Investment Holdings Pty Ltd, and Beecomb Food Industries.
As part of its policies, Super Group commits to pay out at least 50% of net profit as dividends. Thus far, it has managed to do so.
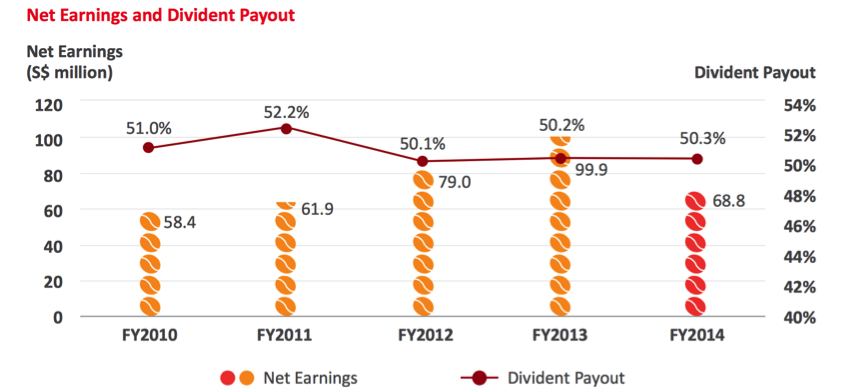
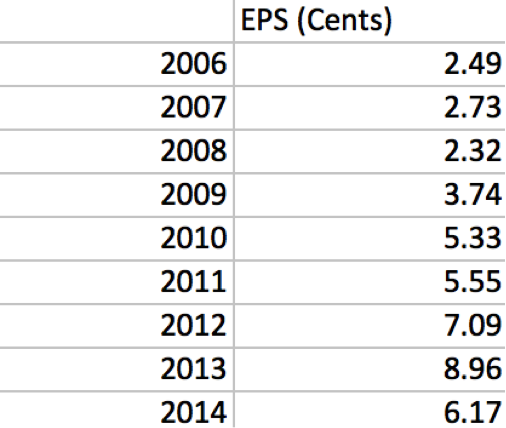
For the year 2014, Super Group initiated to issue a 1-for-1 bonus issue to the shareholders. As such, the earnings shown below are adjusted accordingly to the bonus issue. From FY2006 to FY 2014, Super Group has managed to achieve a Compounding Annual Growth Rate (CAGR) of 10.61%.
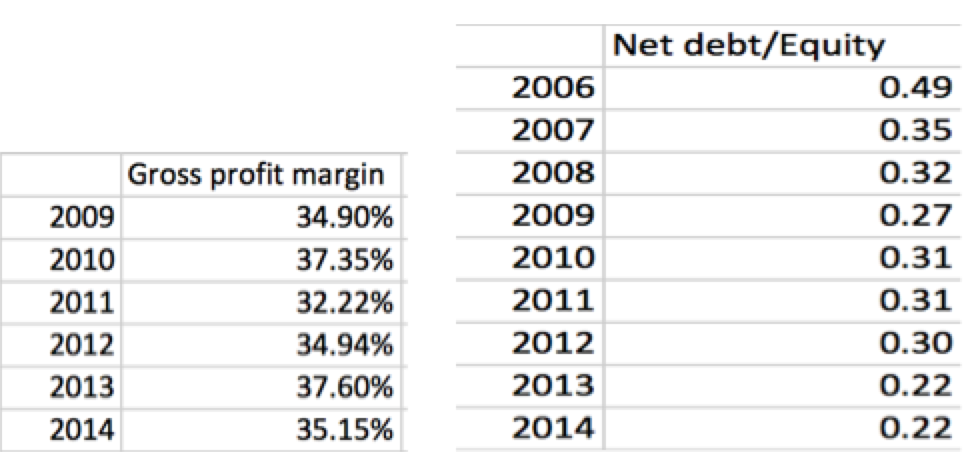
Super Group also has a relatively high gross profit margin as compared with its counterparts. This means that for every $1 in revenue, the firm has 35 cents after paying expenses. Also, through the years, the net debt to equity ratio of Super Group has been decreasing which could be a good sign to investors as it indicates that the company is not highly leveraged.
Apart from these indicators, Super Group has:
- Sufficiently strong financial condition (Long term debt doesn’t exceed net current assets)
- Strong dividend record (Uninterrupted payments since 2006)
- Slightly moderate P/E ratio (Current price is $0.04 more than 15 times average earnings of the past three years)
- Return of Invested Capital (ROIC) of 16.95% (Relatively attractive)
Intrinsic Value
Using the Earnings Power Valuation method, I’ve arrived at less than $592 million or $0.53 per share for Super Group’s Net Reproduction Value. This means that a new potential competitor will have to spend around $592 million in order to compete with Super Group. With the assumption of a discount rate of 9% and average earnings for the past 5 years, using the Net Reproduction Value, the Earnings Power Value (EPV) after Cash-Debt adjustment, stands at less than $985 million or $0.88 per share. Now that we have the EPV per share and the NPV per share, the difference of $0.35 between the 2 indicators is the competitive advantage enjoyed by Super Group.
Using Benjamin Graham’s Intrinsic Value Formula of V=[EPS x (8.5+2g)*2]/Y, I’ve arrived at an intrinsic value of $1.22 with risk free interest rate and corporate bond rate of 2% and 3% respectively.
Using the Discounted Cash Flow valuation, I’ve arrived at an intrinsic value of $1.39 with the discount rate of 9%.
Conclusion
Although earnings did not perform well for the FY2014, Super Group Ltd still remain as an attractive company personally due to its strong and healthy balance sheet. Its relatively moderate performance could be due to the many uncertainties that happened in 2014 such as higher raw material costs, fluctuations in currencies and the prolonged political unrest in the Thai market. With a calculated intrinsic value ranging around $1.22-$1.39, Super Group’s current share price of $1.15 provides a good bargain with a margin of safety to all value investors out there.


Hi, i am Ron from d3. Recently, I just started to learn about investment and wonder how did you execute the earning power valuation method? Is there any recommended books that I can read up to learn more?
LikeLike
Hi Ron, for the earning power valuation (EPV) you first have to find the Adjusted Earnings before interest (EBIT). This is taken by adding the distribution expense, General & Admin expense into the profit before tax.
Next u find the Adjusted earnings after tax which in this case I believe its 17% (although they increased to 25% this year after the expiration of tax incentive). Then you find the adjusted income by deducting the Depiction on PPE to the earnings after tax.
Next you find the EPV per share by dividing the adjusted income over the discount rate (mine is 9% in this case) which gives $0.76 per share.
Because operating earnings ignore the interest on cash balances, I added the surplus cash (Cash – debt) to the EPV which gives me a value of $0.88 per share. This is an average from 2010 – 2014. The year 2014 alone would yield a value of $0.83 per share.
You can check out this website which I got my formulas from: http://www.oldschoolvalue.com/blog/stock-analysis/earnings-power-value-epv-valuation-microsoft/
LikeLike
For books, the best I’ve read is Security Analysis Sixth Edition by Benjamin Graham. Since you just started learning I recommend understanding the different ratios and indicators. If you’re leaning towards the Fundamental Analysis to your investment approach, try to view investment as looking for businesses. My biggest mistake was treating investment as a mathematical problem and just whacking any formulas I know to it. Learn to see the company as your own business and try to explore from there. Also, don’t be shy to email to the Investor Relations Department of the company if you have any doubts!
I’m currently focusing on reading up on Economics as such will be doing less analysis on companies. But if you have any questions, feel free to pose! I will try my best to answer whatever I can.
Lastly, have a great day and all the best to your investing endeavours! 🙂
LikeLike